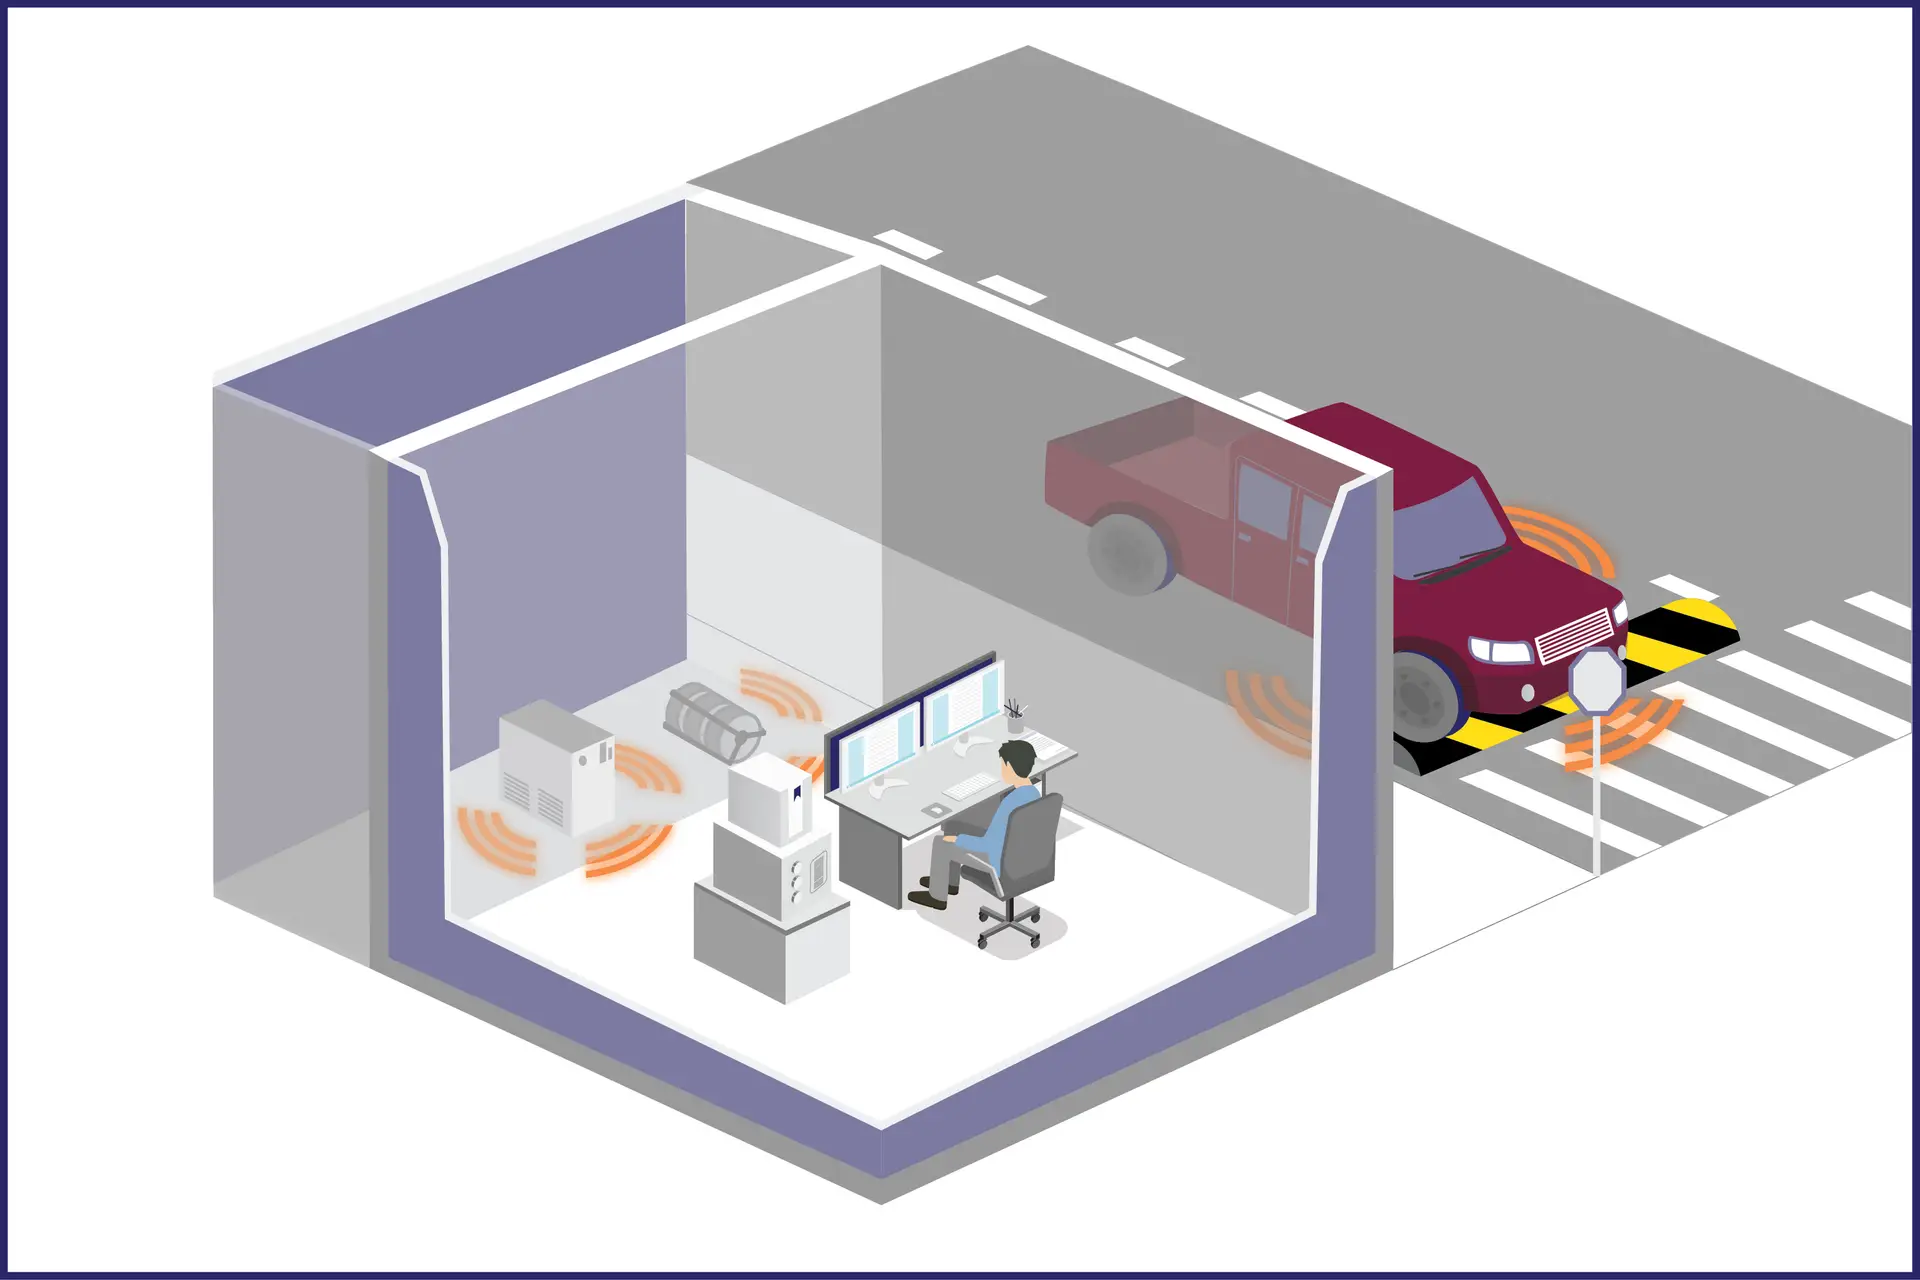
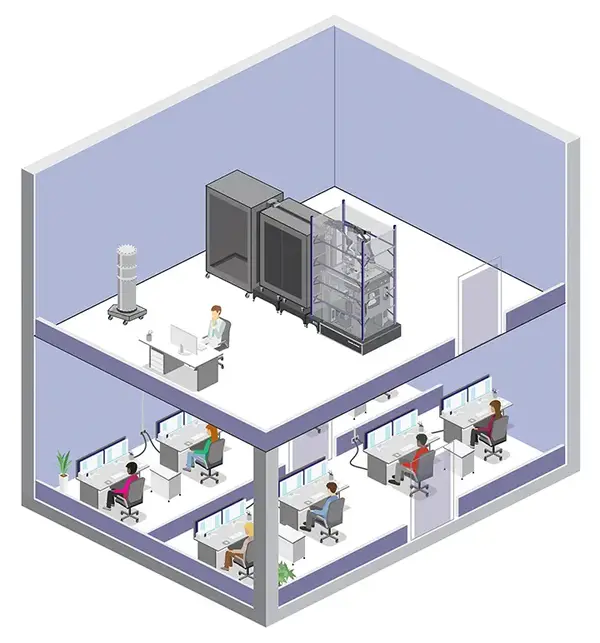
Why a Site Survey Matters
Overview of strategies to meet the stringent EMI specifications of TEMs, including active magnetic field cancellation systems and passive shielding.
Read More
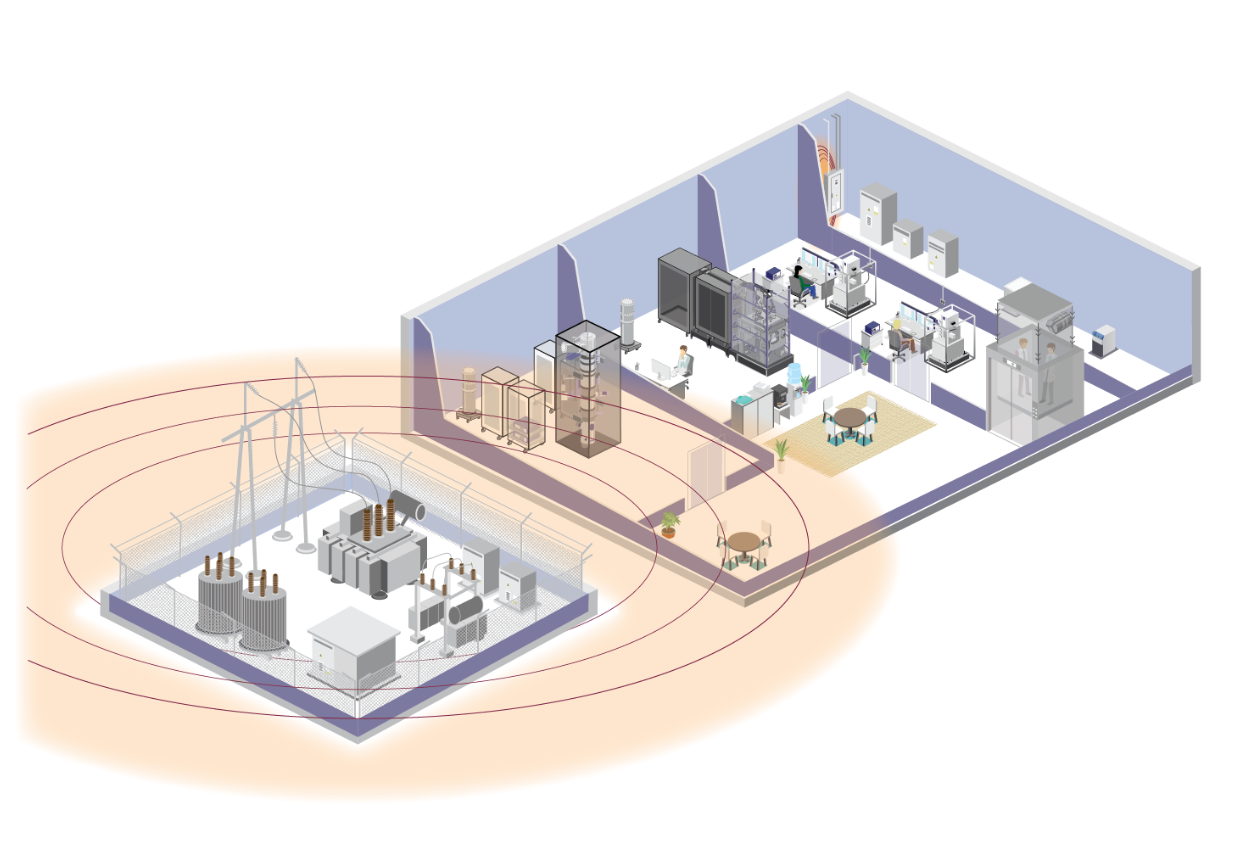
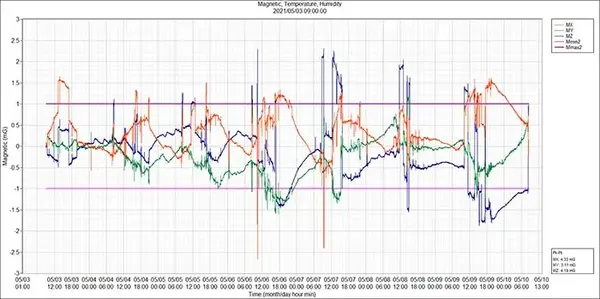
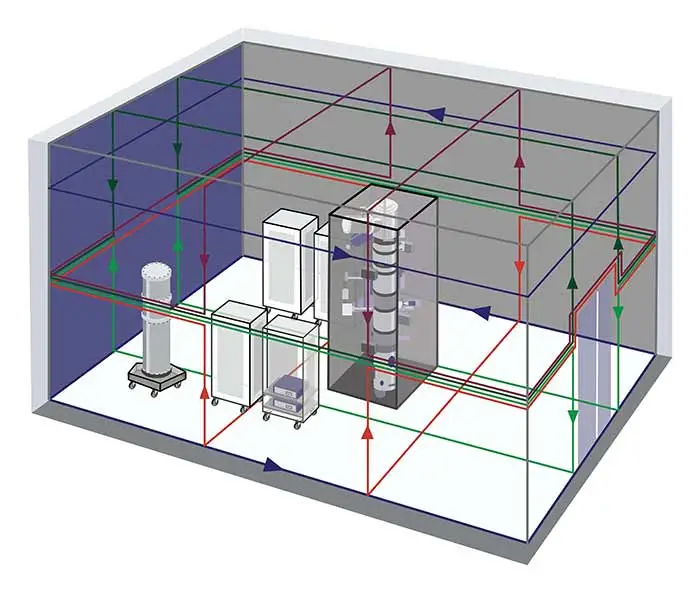
Understanding AC & DC Magnetic Fields in Electron Microscopy Labs
Overview of strategies to meet the stringent EMI specifications of TEMs, including active magnetic field cancellation systems and passive shielding.
Read More
Understanding Vibration Isolation for Electron Microscopes and Precision Instruments
The DVIA Active Isolation System empowers researchers and professionals to use sensitive instruments in environments with significant vibration challenges. By eliminating the limitations of stiff ...
Read More
Electron Microscopes on High Floors: Why VEC’s Daeil DVIA Systems Are the Only Vibration Isolation Option
The DVIA Active Isolation System empowers researchers and professionals to use sensitive instruments in environments with significant vibration challenges. By eliminating the limitations of stiff ...
Read More
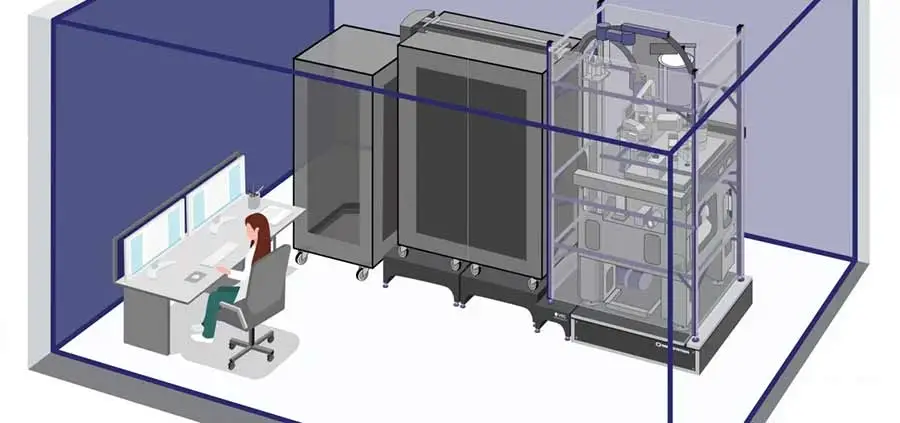
DC & AC Magnetic Field Mitigation Challenges & Solutions for High-Resolution Transmission Electron Microscopes
Overview of strategies to meet the stringent EMI specifications of TEMs, including active magnetic field cancellation systems and passive shielding.
Read More
Vibration Isolation for Cryo-TEM: Over 90% Measured Reduction at 2 Hz
Using a Cryo-TEM in structural biology imaging requires a stable platform to create the 3D images researchers demand. Unfortunately, many facilities that require Cryo-TEM instrumentation ...
Read More